Section 1: Why Traditional Observability Struggles to Predict Modern Software Incidents
Monitoring Shows Current State but Often Misses Emerging Failure Patterns
Modern observability platforms give engineering teams unprecedented visibility into software systems by collecting metrics, logs, traces, events, deployment information, infrastructure telemetry, and application-level signals from thousands of components. This visibility is essential because distributed applications can fail in ways that are difficult to understand from any individual service, but conventional observability remains heavily focused on identifying what is happening at the current moment rather than estimating what is likely to happen next. A service may remain available while response latency gradually increases, a database may continue accepting requests while connection utilization steadily approaches its operational limit, or memory consumption may rise slowly enough that no immediate threshold is violated even though the system is moving toward eventual instability.
The limitation becomes clearer when incidents emerge through combinations of individually normal signals. A moderate increase in request volume may be harmless on its own, and a modest increase in cache misses may also be expected, but when both occur alongside rising database latency and increasing queue depth, the combination can indicate that the system is approaching a failure state. Traditional dashboards can expose each signal, yet engineers still need to identify the relationship among them and determine whether the combined pattern represents normal variation or an early warning sign.
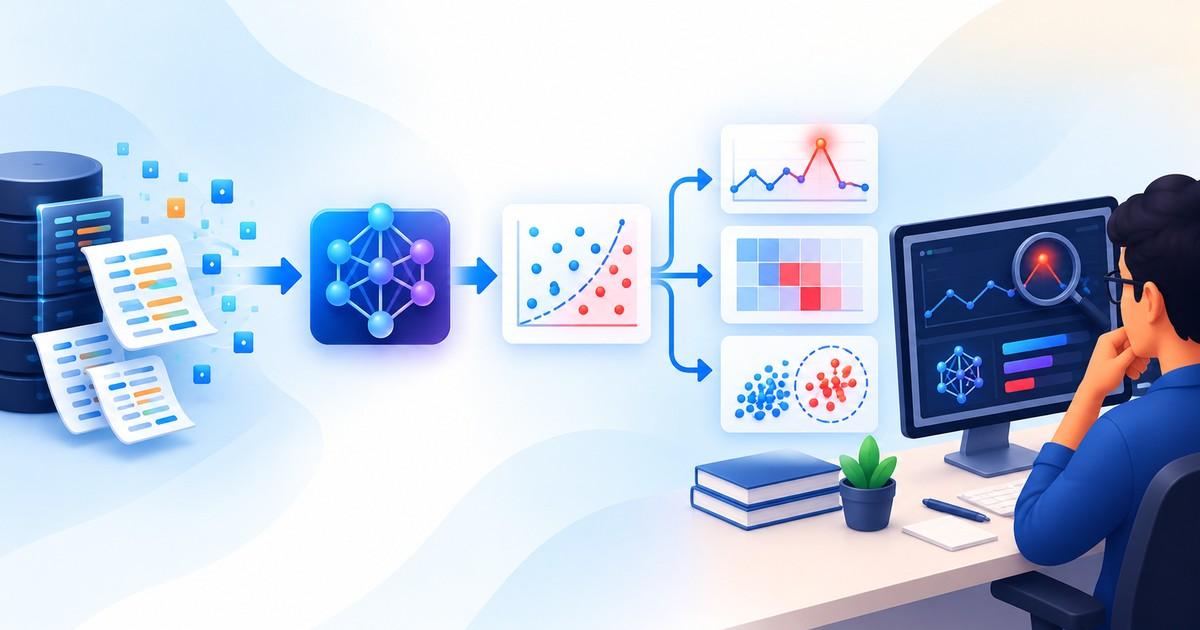
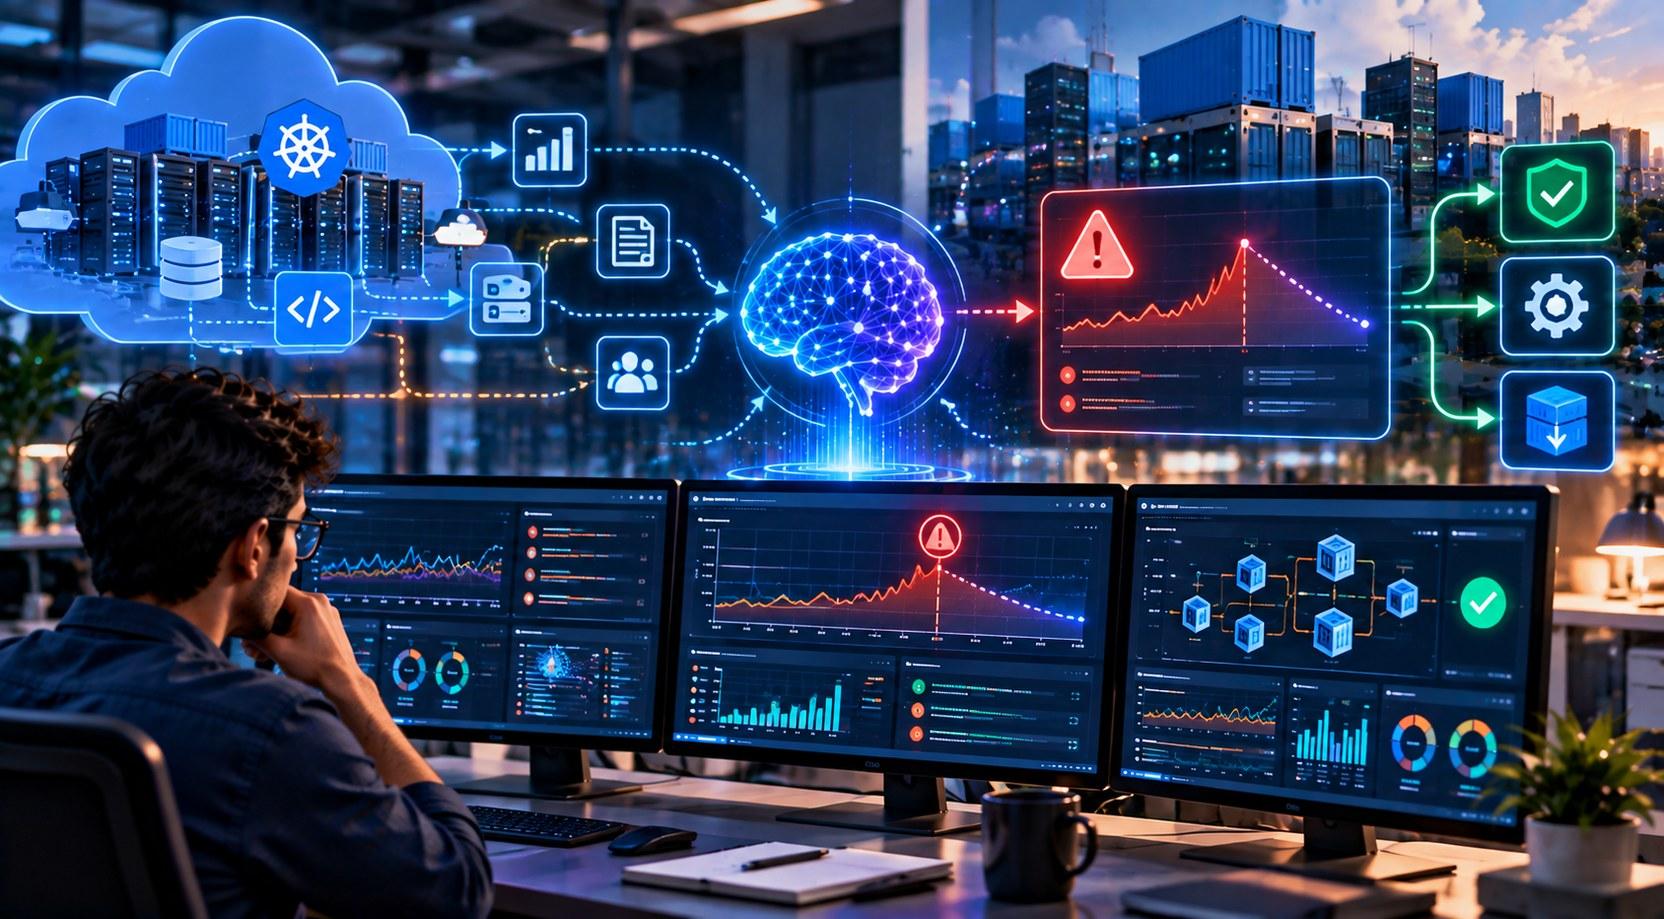
Machine learning introduces the possibility of learning these relationships from historical operational behavior. Instead of waiting for a predefined metric to cross a fixed boundary, an ML system can evaluate many signals together and identify patterns associated with previous incidents or unusual system states. This changes observability from a collection of independent measurements into a behavioral model of the software system, allowing engineers to reason about evolving conditions rather than isolated threshold violations.
Distributed Systems Create Too Many Interconnected Signals for Manual Analysis
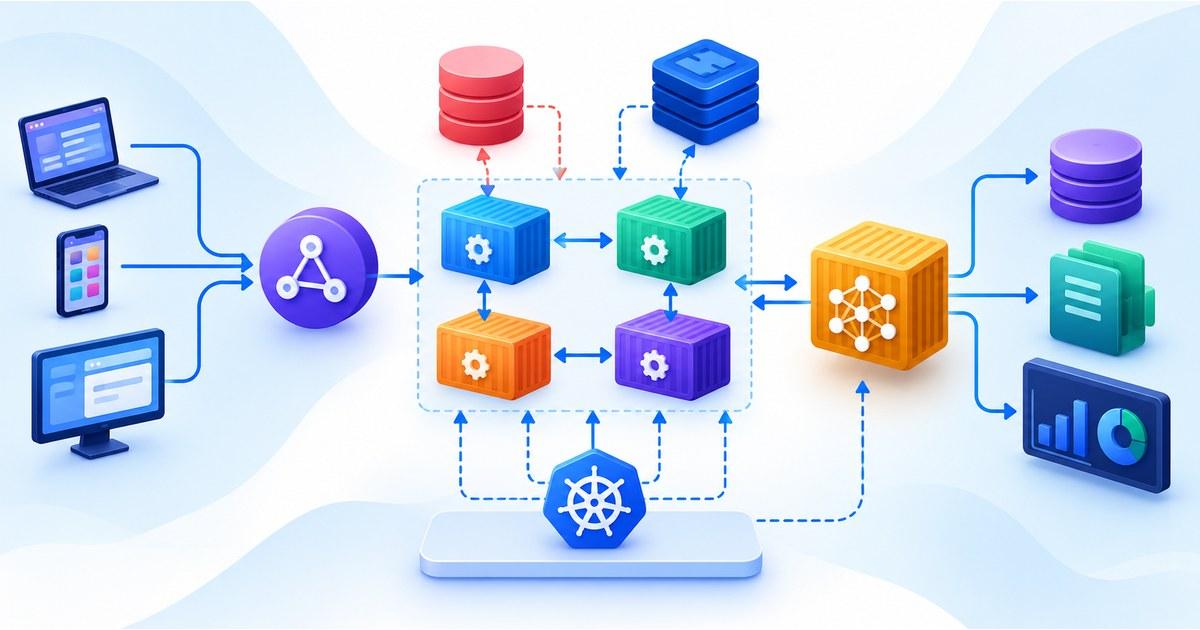
The increasing complexity of distributed architectures has made manual interpretation of observability data increasingly difficult because a single user-facing problem can involve many services and infrastructure layers. A request may pass through an API gateway, authentication service, application layer, message queue, cache, database, external dependency, and storage system before a response reaches the user, with each component generating its own telemetry. When an incident develops, the resulting signals can span multiple services and appear at different times, creating a large search space for engineers attempting to identify the root cause.
This complexity is amplified by dependencies that are not always obvious from service boundaries alone. A downstream database can become saturated because of an upstream deployment, a queue can accumulate messages because an external API has slowed down, or increased latency in one service can cause retries that place additional load on another service. In each case, the incident develops through a chain of interactions rather than a single component failure.
Machine learning can help analyze these large volumes of interconnected telemetry by identifying recurring relationships between signals and operational outcomes. Rather than requiring an engineer to inspect every dashboard independently, a predictive system can evaluate multiple indicators simultaneously and determine whether their combined behavior resembles patterns historically associated with incidents. This does not eliminate the need for human investigation, but it can reduce the amount of raw telemetry engineers must manually interpret before focusing on the most relevant signals.
The broader challenge reflects the hidden complexity described in “The Hidden Engineering Work Behind Every Successful Machine Learning Product,” because successful predictive observability depends not only on model development but also on collecting reliable telemetry, preserving context across distributed services, and building infrastructure capable of connecting low-level technical signals to meaningful operational outcomes.
Static Thresholds Struggle With Dynamic Baselines
Threshold-based monitoring is attractive because it is simple to understand and easy to implement. Engineers can define limits such as CPU utilization above a particular percentage, error rates above a specified level, or latency exceeding a fixed duration, and an alert is generated whenever the observed metric crosses that boundary. The problem is that modern software systems rarely operate around a single stable baseline, which means the same value can be normal during one period and abnormal during another.
Traffic patterns can vary by hour, day, season, product launch, marketing activity, geographic region, or customer behavior. A service handling thousands of requests per second may operate normally at that level during a peak period while becoming unhealthy at a much lower volume during another operating condition. Static thresholds cannot easily represent these changing baselines because they evaluate observations against fixed limits rather than against the context in which those observations occur.
Machine-learning models can instead learn expected behavior across different temporal and operational conditions. A predictive observability system might learn that a particular latency level is normal during peak traffic but unusual when request volume is low, or that memory usage typically rises during a deployment but should stabilize afterward. This contextual understanding allows the system to distinguish expected variation from behavior that deserves investigation.
Dynamic baselines also reduce the need for engineers to manually maintain large collections of thresholds as applications evolve. Rather than continuously adjusting alert boundaries for every service, models can learn from historical behavior and update expectations as workloads change, provided that the training and monitoring processes are designed carefully enough to avoid learning harmful or anomalous states as normal.
Key Takeaway
Traditional observability provides essential visibility into what software systems are doing, but modern distributed applications generate too many interconnected and dynamic signals for static thresholds and manual inspection to reliably identify every emerging failure pattern. Machine learning can extend observability toward prediction by learning normal system behavior, recognizing relationships across telemetry, detecting contextual deviations, and identifying patterns that may precede incidents, creating an opportunity to move software reliability from primarily reactive monitoring toward earlier and more informed intervention.
Section 2: How Machine Learning Learns the Warning Signs of Software Incidents
Anomaly Detection Identifies Deviations From Normal System Behavior
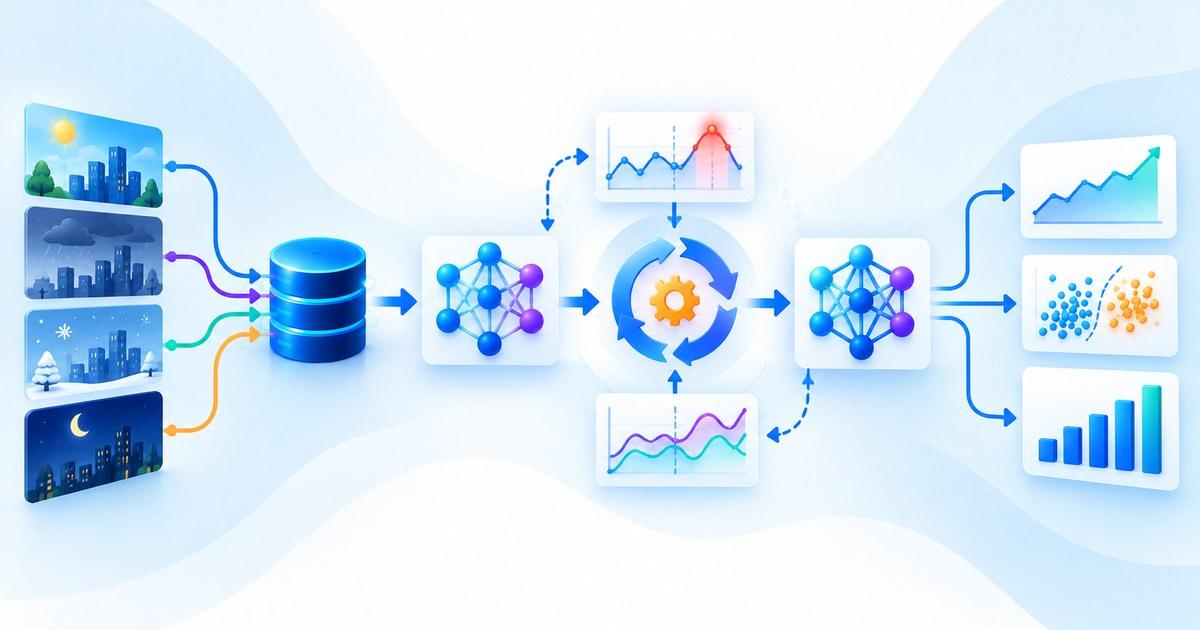
Machine learning can make software observability more predictive by learning what normal system behavior looks like and identifying deviations that may indicate emerging operational problems. Traditional monitoring generally relies on predefined thresholds, while anomaly-detection models can establish expected behavior from historical telemetry and evaluate new observations against that learned baseline. This is particularly useful for systems where normal behavior changes throughout the day, across deployment cycles, or under different workload conditions, because the model can consider context rather than treating every metric as though it has one fixed acceptable range.
Anomaly detection becomes more valuable when multiple signals are evaluated together because incidents often develop through combinations of changes rather than through one extreme metric. A gradual increase in latency may not be concerning by itself, but if it occurs alongside rising queue depth, increased retries, declining cache efficiency, and growing database utilization, the combined pattern may resemble the early stages of a historical incident. A machine-learning model can learn correlations among these signals and identify multivariate states that would be difficult to capture using independently configured alerts.
Different anomaly-detection approaches can serve different observability requirements. Statistical techniques can identify deviations from expected distributions, while clustering and representation-learning methods can group similar operational states and highlight unusual ones. Sequence-based models can evaluate whether the order and timing of events differs from historical patterns, which is important because the same signals can have different meanings depending on when they appear and what preceded them. The challenge is ensuring that anomalies are interpreted as indicators requiring investigation rather than automatic proof that a failure is imminent.
Time-Series Models Detect Trends That Precede Failures
Many software incidents develop gradually, which makes time-series modeling particularly useful for predictive observability because the important information may exist in how a metric changes over time rather than in its current value. Memory usage that rises consistently after every deployment, queue depth that accelerates during periods of increasing traffic, or latency that gradually deteriorates under growing concurrency can provide evidence that the system is moving toward an unstable state even when current measurements remain within normal operating limits.
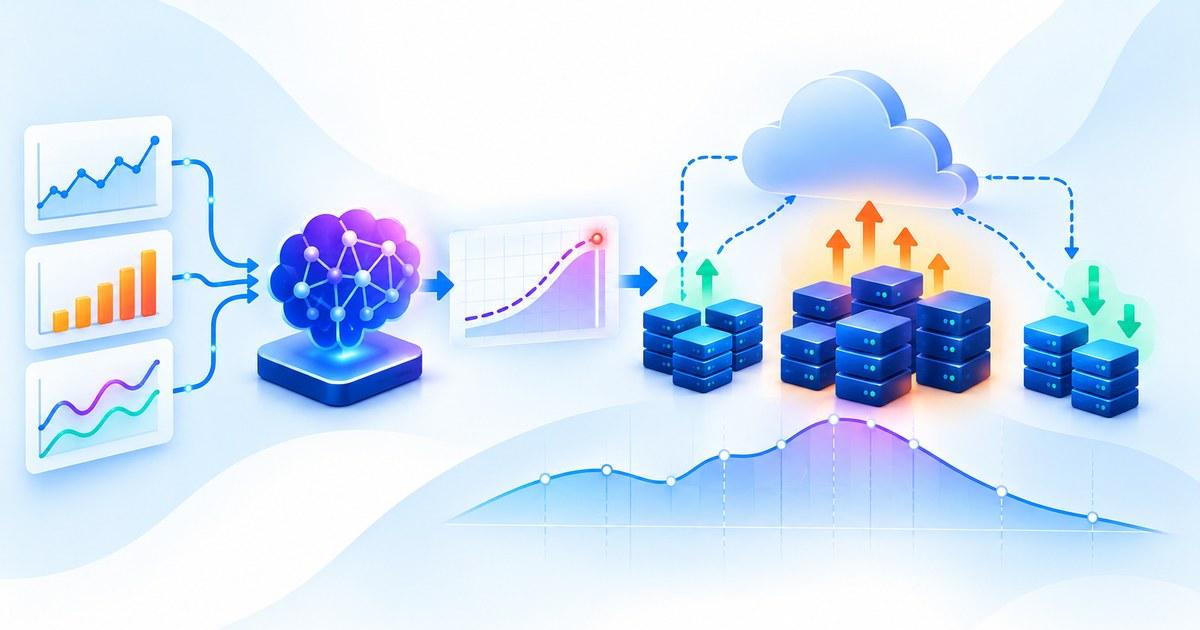
Time-series models can learn recurring temporal patterns and estimate expected future behavior, allowing observability systems to compare the current trajectory with what normally happens under similar conditions. Forecasting can help engineers identify whether a resource is likely to reach a dangerous utilization level, while sequence classification can estimate whether a developing telemetry pattern resembles the early stages of previously observed incidents. These capabilities extend observability beyond describing the current state toward estimating how the system may evolve over the next several minutes or hours.
The quality of these predictions depends heavily on temporal context because software systems frequently exhibit strong periodic behavior. Request volume, CPU utilization, queue depth, and database activity may follow hourly or weekly cycles, while deployment events can create short-lived changes that should not automatically be interpreted as failures. A useful model therefore needs to understand both regular seasonality and meaningful deviations from that seasonality so that expected operational behavior does not produce unnecessary alerts.
This challenge connects with the broader issue discussed in “Machine Learning Under Distribution Shift: What Happens When the World Changes,” because the behavior of a software system can change after architectural modifications, traffic growth, dependency changes, or new deployment patterns. A model trained on historical telemetry may initially perform well but gradually become less reliable when the underlying system evolves, making continuous evaluation and recalibration important components of predictive observability.
Graph-Based Models Learn Dependencies Across Services
Observability data has an important structural property that ordinary time-series models can overlook: software components are connected. Services call other services, databases support multiple applications, queues connect producers and consumers, and infrastructure resources can influence many downstream workloads. A production incident therefore frequently propagates through a dependency graph, meaning that understanding relationships among components can be as important as understanding individual metrics.
Graph machine learning provides a natural framework for representing these relationships. Services can be represented as nodes, communication paths can become edges, and telemetry can be attached to those entities as time-varying features. A graph-based model can then learn patterns involving both the behavior of individual components and the structure of their dependencies, helping engineers identify situations in which a change in one service may create risk elsewhere in the system.
This is especially valuable for incident prediction because the earliest warning signal may not occur in the component that eventually fails. A database may show normal behavior until an upstream service begins generating excessive requests, while a queue may remain stable until a downstream consumer experiences a subtle performance degradation. By incorporating topology into the model, predictive observability systems can analyze how operational states propagate across services rather than evaluating telemetry in isolation.
Key Takeaway
Machine learning can predict software incidents more effectively when it learns temporal patterns, multivariate anomalies, service dependencies, and relationships across metrics, logs, traces, and operational events. Anomaly detection identifies unusual states, time-series models recognize deteriorating trajectories, graph models capture dependency-driven propagation, and multimodal systems combine complementary evidence, creating a richer foundation for identifying operational risk before it becomes a customer-facing incident.
Section 3: Building Predictive Observability Systems That Engineers Can Trust
Training Data Must Represent Rare and High-Impact Incidents
Building a predictive observability system is fundamentally different from building a conventional prediction model because the events that engineers most care about are often the least common events in the available telemetry. Production incidents may represent only a tiny fraction of total system activity, while the overwhelming majority of observations correspond to healthy operation. This creates a severe class-imbalance problem because a model can achieve apparently strong aggregate accuracy simply by predicting that the system will remain healthy most of the time, even though such a model provides little practical value for incident prevention.
Engineers therefore need training datasets that preserve examples of meaningful failures, near-failures, degraded operating states, and the temporal patterns that preceded them. Historical incident records can provide valuable supervision when they contain reliable timestamps and enough contextual telemetry to reconstruct how the system evolved before the failure. Deployment events, configuration changes, traffic spikes, dependency failures, resource saturation, and recovery actions can add further context, allowing the model to distinguish different pathways that can eventually lead to similar outcomes.
The challenge becomes more difficult when historical incidents are sparse or inconsistent because labels may depend on human judgment, incident severity definitions may change, and some failures may never have been formally recorded. Engineers can therefore combine supervised incident prediction with unsupervised anomaly detection and semi-supervised approaches that learn normal system behavior while using limited incident labels.
Models Need to Distinguish Noise From Genuine Operational Risk
Software telemetry is inherently noisy because production systems contain temporary spikes, asynchronous workloads, retries, background jobs, scheduled maintenance, deployments, and other forms of variation that do not necessarily indicate impending failure. A predictive observability model that treats every unusual event as a high-risk condition can quickly become unusable because engineering teams receive more warnings than they can investigate. The objective is therefore not to identify every anomaly but to determine which deviations contain meaningful evidence that the system is moving toward an undesirable state.
Context is essential to making this distinction. A sudden increase in CPU utilization during a planned capacity test may be completely normal, while the same increase under ordinary traffic conditions could indicate resource pressure. A latency spike during a known dependency outage may require different interpretation from an identical spike when all dependencies appear healthy. Models can incorporate deployment metadata, traffic characteristics, historical seasonality, service topology, and recent operational events to distinguish expected changes from emerging risks.
Threshold calibration is also important because false positives and false negatives have different operational costs. Too many false positives contribute to alert fatigue and can cause engineers to ignore future predictions, while excessive false negatives allow genuine incidents to pass through the monitoring system unnoticed. Teams therefore need evaluation metrics that reflect operational priorities rather than relying exclusively on generic classification accuracy. Precision, recall, detection lead time, incident coverage, and false-alert frequency can provide a more realistic picture of whether the system is helping engineers respond earlier without overwhelming them.
This reliability requirement connects with “Failure Modes of Modern AI Systems and How Engineers Prevent Them,” because a predictive observability model must be treated as another production system with failure modes of its own. Engineers need to understand how the model behaves when telemetry is missing, when new services are introduced, when system behavior changes, and when the model becomes uncertain, rather than assuming that prediction quality remains stable after deployment.
Explainability Helps Engineers Understand Why an Incident Is Predicted
A prediction that an outage is likely to occur is useful only when engineers can understand enough of the evidence to decide how seriously to treat it. Incident response is inherently investigative, so a predictive system that produces an unexplained risk score can create friction instead of reducing it. Engineers need contextual information that connects the prediction to observable system behavior, such as which services changed, which metrics deviated, which dependencies became unstable, and which historical incident patterns resemble the current state.
Explainability does not require exposing every internal detail of a complex model. A practical system can instead surface contributing signals, affected services, changes in temporal behavior, and relevant historical patterns that allow engineers to validate the prediction using familiar observability tools. For example, a model could identify rising database latency, increasing retries, and growing queue depth as the primary evidence behind an elevated incident risk, allowing the engineer to investigate those components directly.
Explainability also creates a feedback mechanism between human operators and the predictive system. When engineers can understand why a prediction was generated, they can provide more meaningful feedback about whether the signal was useful, misleading, or associated with a known operational condition. Over time, that feedback can improve data quality, labeling, model calibration, and operational workflows, provided that the learning process is carefully controlled so that human responses do not introduce additional bias.
Key Takeaway
Trustworthy predictive observability depends on representative incident data, careful handling of noise and class imbalance, interpretable risk signals, and deep integration with established SRE workflows. Machine learning becomes operationally valuable when it provides enough lead time and context for engineers to investigate and act, while remaining calibrated against the costs of false positives, missed incidents, changing system behavior, and uncertainty in the underlying telemetry.
Section 4: The Future of AI-Powered Software Reliability
Observability Systems Will Move From Detection Toward Prediction
The next stage of software observability is likely to focus increasingly on predicting how system behavior will evolve rather than simply identifying whether a failure condition already exists. Traditional monitoring answers questions about current availability, latency, resource utilization, and error rates, while machine-learning-driven observability can extend that capability by estimating whether the current trajectory resembles conditions that have historically preceded incidents. This allows reliability teams to move from reacting to symptoms toward investigating emerging operational risks while the system still has enough capacity and flexibility to absorb corrective action.
Predictive observability can become particularly valuable when incidents develop gradually because many production failures are preceded by weak signals that individually appear insignificant. A slow increase in memory consumption, a subtle rise in retry frequency, a growing queue, and a small reduction in cache effectiveness may collectively indicate a deteriorating state even though none of those signals independently crosses a conventional alert threshold. ML systems can evaluate these patterns continuously, incorporate temporal context, and estimate whether the combined state is becoming more consistent with known failure pathways.
This capability could also change incident-response priorities because teams may begin organizing reliability work around predicted risk rather than only around active alerts. An engineering organization could identify services whose operational risk is increasing, investigate emerging dependencies, and prioritize preventive work before customer-visible impact occurs.
ML Models Will Help Connect Technical Signals to Business Impact
Technical observability traditionally focuses on infrastructure and application health, but future predictive systems can increasingly connect those signals to the business consequences associated with a potential incident. A five-percent increase in latency does not have the same significance for every service because the operational importance depends on which customers rely on the service, which transactions are affected, and how quickly the degradation is likely to propagate. Machine learning can help combine technical telemetry with service dependencies, traffic patterns, customer behavior, and historical incident outcomes to estimate where an operational problem may create meaningful business impact.
This relationship becomes especially important in large organizations where thousands of telemetry signals may be available but engineering resources remain limited. A predictive system could identify that several low-level anomalies are concentrated around a critical customer workflow and elevate that risk above a similar anomaly affecting a low-priority internal service. Such contextual prioritization can reduce the gap between infrastructure monitoring and business-oriented reliability because engineers receive not just an indication that something is unusual, but information about why the condition may matter.
The approach also creates opportunities for more intelligent capacity and reliability planning because models can estimate how changing traffic, deployments, dependencies, or resource utilization may influence future system behavior. Instead of waiting for a service to approach saturation, teams can evaluate projected load and identify components likely to become bottlenecks under expected growth. This turns observability data into an input for architectural planning rather than limiting its role to incident response.
Autonomous Remediation Could Follow Predictive Incident Detection
Once predictive observability systems become reliable enough, the next logical step is connecting high-confidence predictions to controlled remediation workflows. An ML system that detects a likely resource saturation event could automatically increase telemetry collection, recommend scaling actions, shift traffic, restart a known-failing component, or invoke an established operational procedure. The important distinction is that predictive intelligence does not necessarily require fully autonomous decision-making because many valuable actions can remain bounded by predefined rules, approval thresholds, and reversible controls.
A layered automation strategy can therefore provide a safer transition from prediction to action. Low-risk interventions can be automated when the model has strong evidence and the action is easily reversible, while high-impact changes can require human approval. This architecture preserves operational safeguards while allowing machine learning to reduce response time in situations where engineers would otherwise need to perform repetitive manual steps.
Feedback becomes particularly important once automated actions are introduced because the system's response can change the future telemetry that the model observes. If an automated scaling action prevents an incident, future training data may contain fewer examples of the failure condition, while an incorrect remediation can create new telemetry patterns that were not present in historical data. These interactions make predictive observability a dynamic control problem rather than a one-way prediction pipeline, reinforcing the concerns discussed in “The Challenge of Feedback Loops in Production Machine Learning.”
Key Takeaway
AI-powered observability is moving toward systems that predict emerging incidents, connect technical anomalies to business impact, recommend or execute controlled remediation, and feed reliability insights back into software development and architecture. The long-term opportunity is not simply to generate earlier alerts, but to create an adaptive reliability layer that continuously learns from system behavior and helps engineering teams prevent failures before they become customer-facing incidents.
Conclusion
Machine learning is changing software observability by expanding its purpose from describing what a system is doing to estimating what the system may do next. Traditional observability remains essential because metrics, logs, traces, events, and dashboards provide the evidence engineers need to understand production behavior, but the increasing complexity of distributed software makes it increasingly difficult to identify emerging incidents through static thresholds and manual analysis alone. A modern application can generate thousands of interacting signals across services, databases, queues, infrastructure, and external dependencies, while many serious incidents develop gradually through combinations of small changes rather than one obvious failure.
Predictive observability addresses this problem by treating telemetry as a source of temporal and relational information that machine-learning systems can analyze continuously. Instead of asking only whether latency is currently too high or whether a service is currently unavailable, engineers can build models that learn normal operational behavior, identify deviations, recognize deteriorating trajectories, and estimate whether the current state resembles patterns that historically preceded incidents. This creates an opportunity to intervene before an outage, degradation, or capacity failure becomes visible to users.
The transformation is important because the most useful predictive signal is often not a single metric.
An increase in database latency may be harmless during a traffic spike, while the same increase combined with growing queue depth, retry rates, cache misses, and connection utilization can indicate that a system is moving toward instability. Machine learning can analyze those signals jointly and identify relationships that would be difficult to represent using thousands of independent alert rules. Time-series models add temporal context, allowing systems to recognize patterns that emerge over minutes or hours, while graph-based approaches can incorporate dependencies among services and infrastructure components.
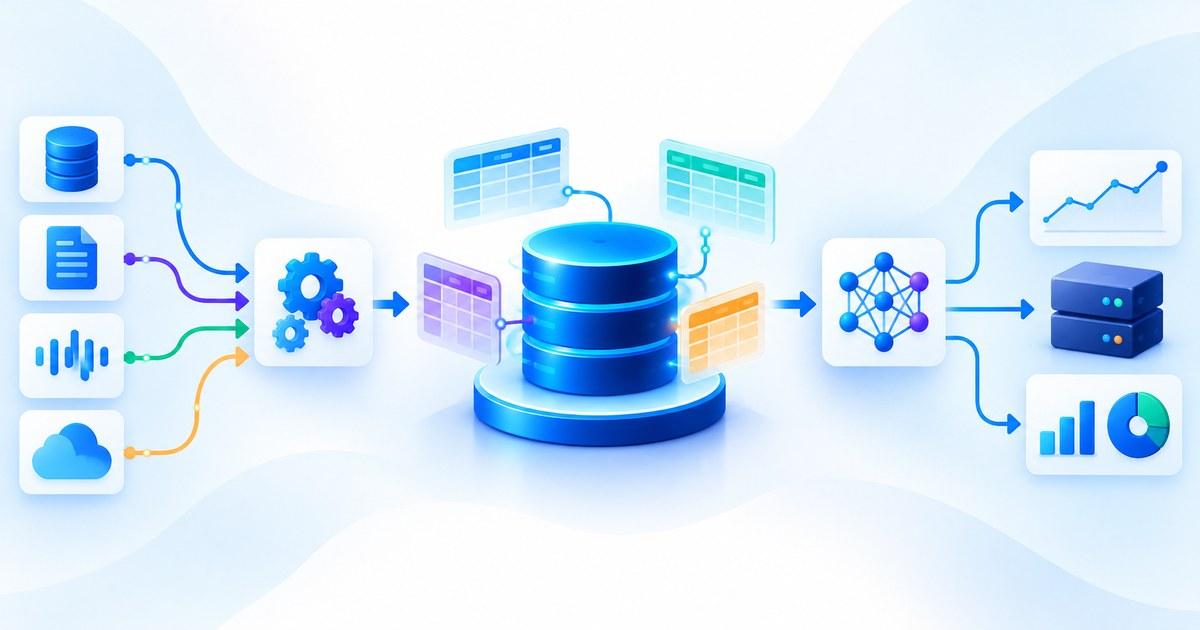
Multimodal telemetry creates another significant opportunity because metrics, logs, traces, deployment events, and infrastructure changes describe different aspects of the same system. Metrics can reveal aggregate behavior, traces can expose request paths, logs can provide diagnostic context, and deployment events can explain why a previously normal pattern changed. A predictive observability platform that combines these sources can create a richer representation of system state than any individual telemetry stream can provide.
However, prediction alone does not create reliable observability.
One of the hardest problems is the rarity of serious incidents. Most production telemetry represents healthy operation, while failures occupy only a very small portion of the available data. This creates class-imbalance challenges and makes naive accuracy metrics almost meaningless for evaluating incident prediction. A model can appear highly accurate simply by predicting that no incident will occur, yet provide virtually no operational value. Engineers therefore need representative incident histories, near-failure examples, meaningful labels, strong baselines, and evaluation metrics that reflect the actual cost of false alarms and missed incidents.
Frequently Asked Questions
1. What is machine learning for software observability?
Machine learning for software observability applies statistical and ML techniques to telemetry such as metrics, logs, traces, events, and deployment data to identify anomalies, recognize patterns, estimate future system behavior, and potentially predict incidents before they affect users.
2. How is predictive observability different from traditional monitoring?
Traditional monitoring typically evaluates current system conditions against predefined rules or thresholds, while predictive observability attempts to understand how system behavior is evolving and whether the current pattern resembles conditions that historically preceded incidents.
3. What types of data are used for ML-based observability?
Common inputs include infrastructure metrics, application metrics, logs, distributed traces, service dependencies, deployment events, configuration changes, traffic patterns, resource utilization, and historical incident records. Combining multiple sources can provide stronger context than relying on one telemetry type.
4. How can machine learning detect an impending software incident?
Models can learn normal system behavior and identify changes in temporal patterns, relationships among multiple metrics, service dependencies, or operational events that resemble historical pre-incident conditions. The resulting prediction can indicate elevated risk before a conventional threshold is crossed.
5. What role does anomaly detection play in observability?
Anomaly detection identifies behavior that differs meaningfully from expected system patterns. It can help detect unusual latency, resource utilization, request rates, error behavior, or combinations of signals that may indicate emerging problems.
6. Why are time-series models useful for incident prediction?
Many incidents develop gradually, making the trajectory of a metric more informative than its current value. Time-series models can learn trends, seasonality, recurring patterns, and changing trajectories to estimate whether a resource or service is moving toward an undesirable state.
7. Can graph machine learning improve software observability?
Yes, because distributed software systems contain explicit relationships among services, databases, queues, and infrastructure components. Graph-based models can incorporate these dependencies and help identify how changes in one part of the system may contribute to risk elsewhere.
8. Why are software incidents difficult machine-learning problems?
Serious incidents are relatively rare compared with normal system activity, creating severe class imbalance. In addition, telemetry is noisy, system behavior changes over time, incident labels can be incomplete, and the same symptoms can have very different meanings depending on context.
9. How can teams reduce false positives in predictive observability?
Models can incorporate context such as traffic patterns, deployment events, service topology, historical seasonality, and operational state rather than evaluating individual metrics independently. Careful calibration and evaluation using precision, recall, detection lead time, and false-alert rates are also important.
10. Why is explainability important in AI-powered observability?
Engineers need to understand why a model believes an incident is becoming more likely so they can validate the signal and determine the appropriate response. Showing contributing metrics, affected dependencies, temporal changes, and comparable historical incidents can make predictions more actionable.
11. How should predictive observability integrate with SRE workflows?
Predictions should connect directly to existing dashboards, traces, logs, service maps, incident-management systems, runbooks, and escalation processes. This allows ML-generated risk signals to become part of normal investigation workflows rather than creating a separate operational process.
12. Can machine learning automatically fix software incidents?
It can support controlled automated remediation, such as scaling resources, shifting traffic, increasing telemetry collection, or initiating predefined operational procedures. High-impact actions generally require safeguards, approval mechanisms, and rollback capabilities because an incorrect prediction can produce additional failures.
13. What is the biggest challenge when training an incident-prediction model?
The scarcity and inconsistency of historical incident data is one of the largest challenges because the model needs enough examples of meaningful failures and their preceding signals to learn useful patterns. Teams may need to combine supervised learning with anomaly detection or other approaches when reliable incident labels are limited.
14. Can predictive observability models become outdated?
Yes, because software architectures, traffic patterns, dependencies, deployment practices, and user behavior change over time. Models therefore need continuous evaluation, drift monitoring, recalibration, and controlled retraining so that historical patterns do not become misleading as the system evolves.
15. What is the future of machine learning for software observability?
The field is moving toward predictive reliability platforms that combine anomaly detection, time-series forecasting, dependency-aware modeling, multimodal telemetry, risk prioritization, and increasingly controlled automation. The long-term objective is to help engineering teams identify emerging problems earlier, understand their likely impact, and intervene before technical degradation becomes a customer-facing incident.