Section 1: Why Traditional Log Analytics Needs Machine Learning
Keyword-Based Searching Cannot Capture Every Operational Problem
Traditional log analytics relies heavily on keyword searches, regular expressions, predefined filters, and manually configured alerts to help engineers investigate application behavior. These methods work well when the failure pattern is known, such as searching for a specific exception, identifying repeated HTTP errors, or locating messages associated with a particular service. However, production applications generate enormous volumes of logs containing different formats, dynamic values, stack traces, and messages from interconnected components, making manual investigation increasingly difficult as systems become more distributed.
The limitations become particularly apparent when the same underlying problem produces different log messages across services or application versions. A database connection issue, for example, might appear as a timeout in one service, a failed query in another, and an increasing number of retry messages elsewhere, meaning that a simple search for one error string may fail to reveal the broader incident. Machine learning can help identify similarities among these events by analyzing their structure, textual content, frequency, and relationships with other operational signals, allowing engineers to detect recurring patterns even when the exact wording differs.
ML-powered log analytics does not eliminate traditional search because exact matching remains valuable for known errors, identifiers, stack traces, and incident investigation. Instead, it extends existing observability capabilities by identifying patterns that are difficult to describe through manually maintained rules, making it easier to discover unfamiliar failure signatures and prioritize relevant events within large volumes of operational data.
Production Logs Contain Patterns That Static Rules Often Miss
Application logs contain more than isolated error messages because their frequency, sequence, timing, and relationships can provide important evidence about system behavior. A gradual increase in database warnings, repeated authentication failures, unusual retry sequences, or a changing distribution of application events may indicate an emerging problem even when no individual message appears particularly unusual. Static alerts often focus on known conditions, whereas machine-learning models can learn expected patterns from historical observations and identify deviations that merit investigation.
Anomaly detection is particularly useful when engineers cannot enumerate every possible failure scenario in advance, because production systems encounter changing workloads, new dependencies, unexpected inputs, and combinations of conditions that may not have appeared during earlier incidents. Models can analyze log frequencies, event sequences, structured attributes, or combinations of telemetry signals to identify behavior that differs from established baselines, helping teams detect potential failures before conventional thresholds are crossed.
However, unusual log behavior does not automatically indicate a production incident, because legitimate deployments, scheduled jobs, traffic spikes, and new application features can also change event patterns. An effective system must therefore interpret anomalies alongside operational context, including service identity, recent deployments, traffic conditions, and related metrics, rather than treating every statistical deviation as an actionable failure. This principle connects with “Anomaly Detection for Production Systems: Using ML to Find Problems Before Users Do,” where detection becomes useful when deviations are distinguished from normal operational variation.
Unstructured Logs Need to Become Meaningful Model Inputs
One of the main engineering challenges in ML-powered log analytics is converting raw log messages into representations that models can process consistently. A single log stream may contain structured fields, free-form text, timestamps, request identifiers, stack traces, and changing numerical values, so engineers generally need to parse, normalize, and transform these records before applying machine-learning techniques. Without these preprocessing steps, models may treat minor formatting differences as meaningful patterns or struggle to distinguish stable message structure from variable values.
Log parsing can help identify recurring message templates by separating constant text from dynamic fields such as identifiers, timestamps, addresses, and numerical measurements. Once normalized, events can be represented through features such as template frequencies, event counts over time windows, categorical attributes, or text embeddings that capture semantic similarities between messages. These representations allow models to cluster related log events, classify known error categories, or identify unusual sequences without requiring every possible message to be manually labeled.
Feature engineering must also preserve temporal and operational context because the same message can have different significance depending on where and when it occurs. A small number of timeout messages may be normal during a brief traffic fluctuation, while a steadily increasing count across dependent services could indicate a developing incident. Combining message representations with timestamps, service metadata, request rates, and other telemetry provides a more informative view of system behavior than analyzing log text in isolation.
Key Takeaway
Machine learning can extend traditional log analytics by identifying recurring patterns, unusual event sequences, and relationships across application logs that keyword searches and static rules may overlook. The strongest systems combine log parsing, meaningful feature representations, contextual anomaly detection, and integration with existing observability tools, helping engineers transform large volumes of raw operational events into earlier warnings and more actionable evidence while preserving conventional monitoring for known failure conditions.
Section 2: How Machine Learning Converts Raw Logs Into Predictive Signals
Log Parsing and Normalization Create Consistent Data
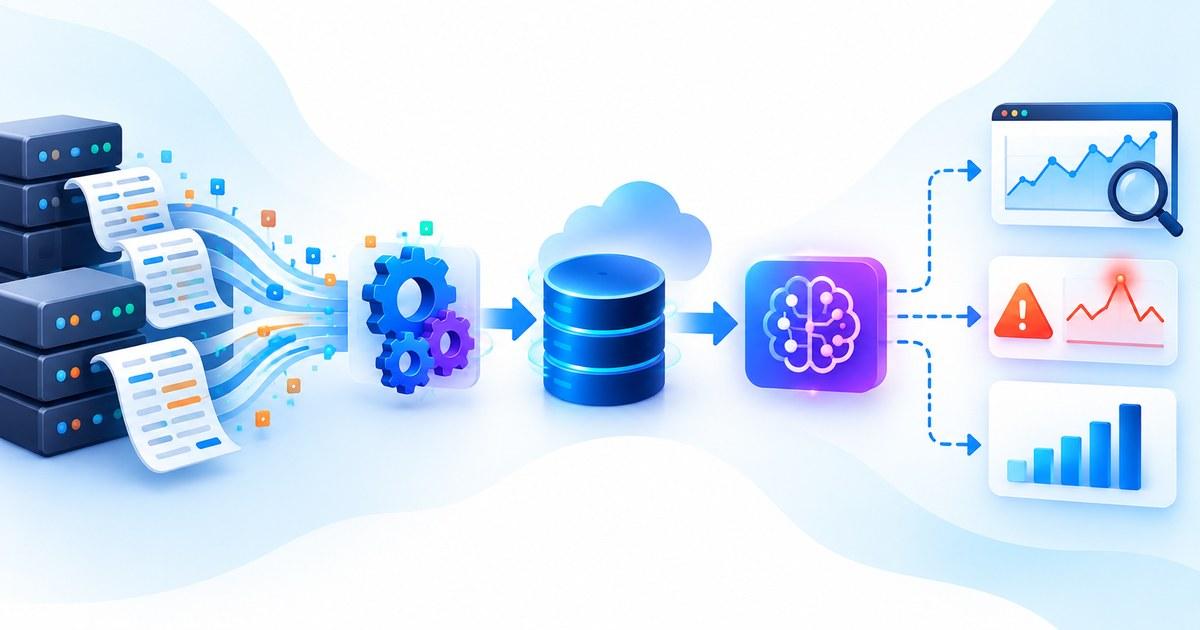
Raw application logs contain a mixture of timestamps, severity levels, service identifiers, message text, stack traces, request identifiers, and dynamic values, making direct analysis difficult when every event is represented differently. ML data pipelines begin by parsing these records into structured fields and normalizing recurring message patterns, allowing engineers to separate stable message templates from variable information such as transaction IDs, timestamps, file paths, and numerical measurements. This transformation helps the system recognize that two messages describing the same underlying error may be related even when their dynamic fields differ.
Log template extraction can further group recurring messages according to their structure, reducing the complexity of analyzing millions of events individually. For example, messages containing different user identifiers but sharing the same authentication failure pattern can be represented through a common template and associated metadata, allowing downstream models to analyze changes in frequency, timing, and distribution. Engineers must still preserve meaningful variations because an error involving a specific dependency or operation may carry different operational significance from an otherwise similar message generated by another component.
Normalization also needs to account for schema evolution, malformed records, missing fields, and changes introduced by application releases, because inconsistent preprocessing can create artificial anomalies or hide genuine changes in system behavior. The resulting pipeline should preserve the original event for investigation while maintaining a normalized representation suitable for feature generation, model evaluation, and long-term trend analysis.
Text Representations and Embeddings Reveal Semantic Relationships
Once logs have been parsed and normalized, machine-learning models can analyze their textual content to identify similarities among error messages that do not share identical wording. Traditional text representations, such as token counts and TF-IDF features, can capture recurring terminology and message patterns, while learned embeddings can represent semantic relationships between messages, potentially grouping different descriptions of similar failures into related regions of a vector space. This becomes useful when application teams use different wording for related operational events or when error messages evolve across software versions.
Embedding-based representations can support clustering, classification, similarity search, and other analytical tasks that help engineers organize large collections of log events. A system might group semantically related database timeout messages across several services, making it easier to identify a shared dependency problem instead of investigating each message type independently. However, embeddings do not automatically establish that two events share the same cause, so engineers need to combine textual similarity with service metadata, timing, dependency relationships, and other evidence before treating clustered events as one operational issue.
The computational requirements of embedding generation also influence architecture because processing every log message with a large model may be too expensive for high-volume production environments. Engineers can use lightweight representations for recurring patterns, batch processing for historical analysis, and more sophisticated embedding models for selected events that require deeper semantic analysis, balancing analytical capability against throughput, latency, and infrastructure cost.
Anomaly Detection and Sequential Features Turn Logs Into Predictive Signals
Log analytics becomes particularly valuable when models analyze not only message content but also how event patterns evolve over time. Engineers can generate features such as event frequency, error ratios, template counts, inter-event intervals, sequence transitions, and changes in the distribution of log messages, allowing detection models to identify behavior that differs from the system's established baseline. A gradual increase in retry events, for example, may provide an earlier indication of a developing dependency problem than waiting for a large number of explicit failures.
Sequential analysis adds another dimension by examining the order in which events occur, since operational failures often produce recognizable sequences across application components. A sudden increase in connection errors followed by retry messages and request timeouts may suggest a different problem from an isolated warning, particularly when the sequence coincides with changes in service latency or resource utilization. Combining temporal features with metrics, traces, and deployment context can therefore produce more informative signals than analyzing log text alone.
These methods connect with “Real-Time Anomaly Detection: Engineering ML Systems That Detect Problems as They Happen,” because the practical value of a detection model depends on transforming incoming observations into timely and actionable signals. Engineers should evaluate detection delay, false-positive frequency, and missed incidents while accounting for workload changes, since unusual logs do not necessarily represent failures and the same event can have different meanings under different operating conditions.
Key Takeaway
Transforming raw logs into predictive signals requires structured parsing, normalization, text representations, clustering, classification, and temporal anomaly detection, supported by reliable feature engineering and operational context. By combining these methods rather than relying on one model alone, engineers can identify recurring failures, surface previously unseen behavior, and generate more actionable warnings from application logs while controlling computational overhead and avoiding the assumption that every unusual message represents a production incident.
Section 3: Building an ML-Powered Log Analytics Pipeline for Production Systems
Design Scalable Log Ingestion and Streaming Processing
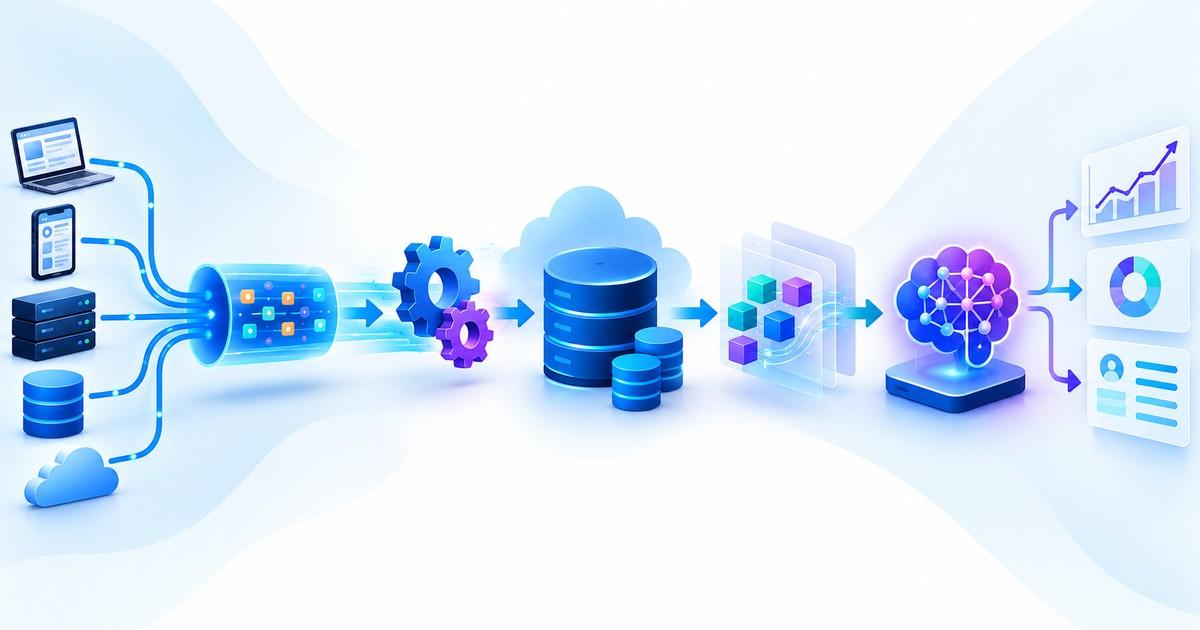
A production ML log analytics pipeline begins with collecting events from application services, databases, infrastructure components, message brokers, and distributed systems while preserving the metadata needed to understand where each event originated. Because logs can arrive at high volume and from independently operating services, engineers need ingestion mechanisms that handle bursts, delayed delivery, duplicate messages, and temporary downstream failures without losing important operational evidence. Streaming platforms can buffer incoming events and distribute processing across consumers, allowing the detection pipeline to analyze continuous log traffic without requiring every event to be processed directly inside the application request path.
The ingestion layer should preserve timestamps, service identifiers, severity levels, deployment versions, request identifiers, and relevant contextual fields so that downstream models can distinguish changes in application behavior from differences in where and when events were generated. Engineers should also establish policies for malformed records, schema changes, sensitive information, and log retention because inconsistent ingestion can introduce artificial anomalies or expose information that should not enter the ML pipeline. These requirements connect with “ML Data Pipelines for Software Engineers: From Event Streams to Model-Ready Data,” where reliable event processing provides the foundation for transforming raw operational data into useful model inputs.
Generate Features and Score Anomalies Within Operational Constraints
After ingestion, the pipeline needs to normalize log messages, extract recurring templates, and generate features that capture both the content and behavior of incoming events. Engineers can calculate rolling event counts, error ratios, template frequencies, changes in message distributions, inter-event intervals, and service-specific statistics, allowing the model to recognize unusual activity that may not be apparent from individual log records. These features can be computed over sliding time windows or incrementally updated as events arrive, with the appropriate processing method determined by data volume, required detection speed, and available infrastructure.
The scoring architecture should keep pace with the incoming event rate without consuming resources that interfere with the applications being monitored. Lightweight template-based models or statistical detectors may be appropriate for high-volume signals, while more computationally expensive embeddings or classification models can be reserved for selected messages that require deeper analysis. Engineers can also separate immediate detection from deeper investigation by generating fast anomaly scores in the streaming path and processing complex relationships asynchronously, ensuring that sophisticated analysis does not unnecessarily delay operational alerts.
Thresholds need to be calibrated using representative historical behavior because an unusual log pattern is not necessarily evidence of an incident. Engineers should evaluate alert precision, missed anomalies, detection delay, and processing overhead while accounting for legitimate traffic changes, deployment activity, and recurring workloads, allowing the system to identify meaningful deviations without producing excessive notifications.
Correlate Logs With Metrics, Traces, and Deployment Context
Individual log events rarely provide enough information to explain a production problem, making correlation across multiple observability signals an important part of the pipeline. A spike in database timeout messages may become more meaningful when combined with increasing query latency, growing connection pools, and longer request traces, while a sudden increase in application exceptions immediately after a deployment may indicate a software regression rather than an infrastructure-wide failure. Correlating these signals allows the system to move beyond message classification and provide engineers with a more complete view of the conditions surrounding an anomaly.
Distributed tracing can connect related operations across services, while metrics provide quantitative evidence about traffic, latency, resource utilization, and error rates. The pipeline can use shared request identifiers, service metadata, time windows, and dependency relationships to associate related observations, helping engineers determine whether several anomalies reflect one underlying incident or independent problems. However, correlation should not be treated as definitive root-cause identification because multiple unrelated failures can occur within the same period, requiring the system to present supporting evidence rather than claiming certainty that the available signals cannot establish.
Key Takeaway
A production ML log analytics pipeline must combine reliable event ingestion, efficient feature generation, timely anomaly scoring, cross-signal correlation, and contextual alert prioritization. By separating fast detection from computationally expensive analysis, connecting logs with metrics and traces, and feeding incident-investigation outcomes back into evaluation, engineers can transform high-volume application logs into actionable operational signals while maintaining predictable processing performance and avoiding unnecessary alert noise.
Section 4: Predictive Incident Detection, Observability, and Production Reliability
Detect Emerging Incidents Before They Affect Users
The primary operational value of ML-powered log analytics comes from identifying behavioral changes that indicate a developing problem before the consequences become visible to users. Instead of waiting for a service to exceed a fixed error threshold, a detection system can recognize combinations of unusual events, gradually increasing warning frequencies, or unexpected sequences of messages that historically preceded incidents. For example, a rise in connection retries combined with increasing database latency and repeated timeout messages may indicate growing dependency pressure, giving engineers an opportunity to investigate before request failures become widespread.
Predictive incident detection requires careful evaluation because unusual log patterns are not always reliable indicators of future failures, particularly when application releases, scheduled workloads, or legitimate traffic increases create patterns that differ from historical behavior. Engineers should correlate anomaly scores with service metrics, deployment records, dependency health, and previous incident timelines to determine whether a detected pattern provides meaningful early warning. The objective is to improve detection lead time without generating excessive alerts that consume engineering attention without preventing actual incidents.
Reduce False Positives Through Contextual Analysis
Anomaly detection becomes more useful when the system interprets unusual log events according to their service, severity, timing, and operational context rather than applying a universal threshold across every application. A short-lived increase in warnings during a deployment may be expected, while a smaller increase in authentication failures or database retries may require investigation depending on the affected service and surrounding signals. Contextual models and rule-based safeguards can therefore work together to distinguish normal operational variation from deviations that deserve attention.
Alert correlation can further reduce unnecessary notifications by identifying several anomalies that likely belong to the same underlying incident. When a failing dependency generates errors across multiple services, grouping related log patterns by time window, service topology, shared identifiers, and dependency relationships can produce a more coherent incident signal than sending an alert for every individual message. Engineers can also incorporate feedback from incident reviews to refine detection thresholds, improve feature representations, and identify recurring false positives without weakening coverage of important failure scenarios.
Maintain Model Reliability as Applications and Logs Evolve
ML-powered log analytics must adapt to changing message formats, application architectures, traffic distributions, and operational practices because models trained on historical telemetry may become less effective as the production environment evolves. A software release can introduce new log templates, a service migration can alter event frequencies, and an infrastructure change can shift metric distributions, potentially causing a detector to flag legitimate behavior or overlook unfamiliar failure patterns. Engineers should monitor feature distributions, anomaly scores, alert frequency, processing delays, and confirmed incident coverage to determine whether the model continues to provide useful signals.
Retraining should be guided by evidence rather than triggered automatically whenever telemetry changes, because frequent updates can absorb developing problems into the learned baseline or reproduce weaknesses in recently collected data. The principles discussed in “How ML Teams Decide When to Retrain a Model” are relevant because model updates should follow observed performance, data quality, and operational requirements rather than assume that newer training data always produces a better detector. Candidate models should be evaluated against historical incidents, known false alarms, and representative production workloads before replacing the current version.
Key Takeaway
Reliable ML-powered log analytics combines early incident detection, contextual alert correlation, continuous model evaluation, and safe integration with established observability workflows. By identifying meaningful changes in logs, distinguishing genuine risk from normal operational variation, adapting to evolving telemetry, and providing actionable evidence for investigation, engineers can use machine learning to detect production problems earlier without allowing false alarms or automated responses to introduce additional operational risk.
Conclusion
Machine learning for log analytics provides a way to transform the enormous volume of application events generated by modern production systems into actionable operational intelligence. Traditional keyword searches, regular expressions, and threshold-based alerts remain valuable for identifying known failure conditions, but they can struggle to recognize unfamiliar error patterns, gradual behavioral changes, and relationships distributed across multiple services. ML-powered analytics extends these capabilities by learning recurring log patterns, detecting unusual event sequences, grouping semantically similar errors, and identifying deviations that warrant investigation before they develop into significant incidents.
The effectiveness of these systems depends on building a reliable pipeline that converts raw logs into meaningful model inputs. Log parsing, normalization, template extraction, feature engineering, and text representations help organize unstructured events into consistent signals suitable for classification, clustering, and anomaly detection. Engineers must preserve important metadata and temporal context throughout these transformations because the meaning of an event often depends on which service generated it, when it occurred, and what other operational signals were present at the same time.
Production architecture is equally important because logs arrive continuously and can generate substantial processing workloads across distributed applications. Scalable ingestion, streaming feature generation, efficient inference, anomaly scoring, and contextual alert correlation must work together to maintain detection speed without creating excessive infrastructure overhead. Integrating logs with metrics, traces, deployment records, and service dependencies further improves the usefulness of the system by giving engineers the context required to investigate unusual behavior rather than treating every anomaly score as a definitive explanation of an incident.
Predictive incident detection also requires careful control of false positives and false negatives. Legitimate deployments, traffic surges, and new application features can produce unusual logs, while emerging failures may initially appear as small changes that remain below conventional alert thresholds. Engineers should therefore evaluate models against historical incidents, monitor detection delay and false-alert frequency, and use contextual information to prioritize anomalies according to their potential operational significance.
Long-term reliability depends on continuous evaluation because application architectures, log formats, user behavior, and infrastructure conditions change over time. Monitoring feature distributions, anomaly scores, alert volumes, and confirmed incidents helps teams identify when a detector becomes less effective, while feedback from incident investigations provides evidence for improving features, thresholds, and models. Controlled model updates and safe automation are especially important because an inaccurate detection can generate operational noise or trigger unnecessary interventions if its output is treated as unquestionable.
Ultimately, machine learning for log analytics is most valuable when it strengthens existing observability and incident-response practices rather than attempting to replace them entirely. By combining reliable telemetry, meaningful representations, anomaly detection, contextual correlation, and continuous evaluation, engineering teams can identify emerging production problems earlier, reduce the effort required to investigate large volumes of logs, and maintain more reliable applications as their complexity and operating conditions evolve.
Frequently Asked Questions
1. What is machine learning for log analytics?
Machine learning for log analytics uses trained models to analyze application logs, identify recurring patterns, classify events, detect anomalies, and surface operational signals that may indicate production problems. It extends conventional log searching by helping engineers recognize patterns that are difficult to capture through manually defined keywords and rules.
2. How is ML-powered log analytics different from traditional log monitoring?
Traditional log monitoring often relies on searches, regular expressions, predefined rules, and fixed thresholds, while ML-powered analytics can learn expected patterns and identify unusual behavior across large collections of events. The two approaches complement each other because conventional rules remain effective for known failure conditions, while ML can help discover unfamiliar patterns and contextual deviations.
3. What types of application logs can machine-learning models analyze?
Models can analyze application logs, database events, authentication messages, infrastructure logs, network events, service errors, stack traces, and other operational records. The most appropriate data depends on the detection objective, with useful signals often emerging when log content is combined with timestamps, service metadata, request context, and related metrics.
4. Why is log parsing important before applying machine learning?
Log parsing converts raw messages into structured representations that models can process consistently, separating stable message templates from dynamic values such as timestamps, identifiers, and numerical measurements. This helps prevent irrelevant formatting differences from overwhelming meaningful patterns and allows engineers to extract useful features from high-volume log streams.
5. What is log template extraction?
Log template extraction groups recurring messages according to their shared structure while separating variable fields from constant text. For example, database timeout messages containing different request identifiers can be represented through a common template, allowing engineers to track frequency changes and detect repeated failure patterns more efficiently.
6. How can embeddings improve log analytics?
Embeddings represent log messages as numerical vectors that capture aspects of their semantic content, allowing systems to identify similar messages even when their wording differs. Engineers can use these representations for clustering, similarity search, classification, and identifying related error patterns across services, although semantic similarity alone does not establish that two events share the same root cause.
7. Which machine-learning algorithms are useful for log anomaly detection?
Useful approaches include statistical baselines, time-series analysis, Isolation Forest, clustering, autoencoders, and other unsupervised or semi-supervised techniques. The appropriate method depends on whether the system analyzes message content, event frequency, temporal sequences, or relationships among multiple telemetry signals.
8. Can machine learning predict production incidents from logs?
ML models can identify patterns that have historically preceded incidents, such as increasing retry frequencies, unusual error sequences, or changes in event distributions. These signals can provide early warnings, but their predictive value depends on data quality, the availability of representative incident examples, and whether the observed patterns provide sufficient lead time for engineers to respond.
9. How can engineers reduce false-positive alerts in ML log analytics?
Engineers can reduce false positives by using contextual baselines, calibrating anomaly thresholds, correlating related events, and accounting for deployments, scheduled workloads, and legitimate traffic changes. Evaluating detection results against historical incidents and incorporating feedback from investigations also helps distinguish operationally meaningful anomalies from harmless variation.
10. What is the role of streaming data in log analytics?
Streaming data allows log events to be processed continuously as applications generate them, enabling timely feature updates, anomaly scoring, and alert generation. Streaming architectures can help engineers identify emerging problems without waiting for large batch-processing jobs, provided that ingestion latency and processing capacity remain appropriate for the production workload.
11. Why should log analytics combine logs, metrics, and traces?
Logs provide detailed event information, metrics describe quantitative system behavior, and distributed traces show how requests move across services. Combining these signals helps engineers investigate anomalies in context, distinguish related symptoms from independent failures, and narrow the scope of an incident without assuming that the model can identify the root cause from logs alone.
12. How should engineers evaluate an ML-powered log analytics system?
Evaluation should include detection precision, recall, false-alert frequency, detection delay, incident coverage, and computational overhead using representative telemetry and known production incidents. Engineers can also replay historical logs, simulate selected failure scenarios, and compare candidate detectors against existing monitoring mechanisms before introducing changes into production workflows.
13. How does data drift affect log analytics models?
Data drift can occur when application releases, new services, infrastructure changes, or evolving workloads alter log formats and event distributions. A detector trained on historical behavior may consequently generate more false alerts or overlook unfamiliar failures, making continuous monitoring of feature distributions, anomaly scores, and confirmed incident coverage essential.
14. Can ML log analytics automatically identify the root cause of an incident?
ML-powered log analytics can identify suspicious patterns and correlate related events, helping engineers narrow down possible causes, but detecting an anomaly does not automatically establish why it occurred. Root-cause investigation generally requires additional evidence from logs, metrics, traces, deployment history, and dependency information, especially when multiple failures produce similar symptoms.
15. How can engineers integrate ML log analytics into existing observability tools?
Engineers can connect log ingestion and anomaly detection pipelines to existing observability platforms, dashboards, alerting systems, and incident-management workflows. Useful integrations provide the detection result alongside relevant log examples, affected services, time ranges, related metrics, traces, and deployment information, allowing engineers to investigate anomalies within their existing operational environment while continuing to monitor the detector's own reliability and cost.